Why this error happens (and why it’s not always a “leak”)
The Node.js runtime runs JavaScript on V8, which manages memory primarily through the heap (where objects live) and the stack (call frames). When you see:
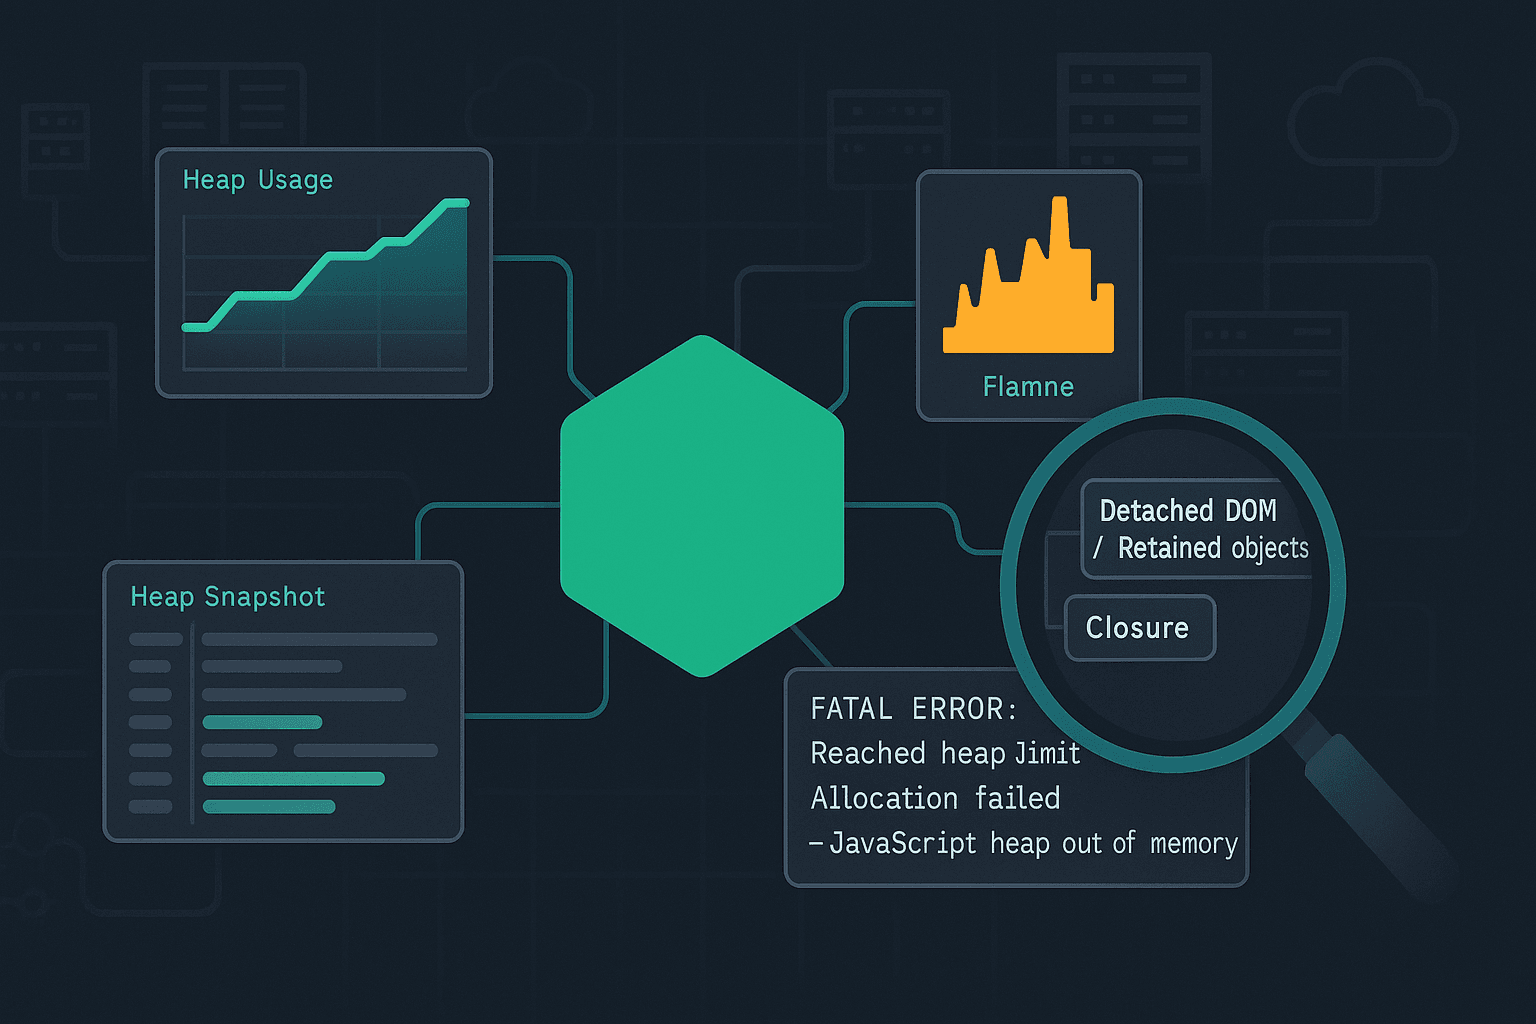
textFATAL ERROR: Reached heap limit Allocation failed - JavaScript heap out of memory
it means V8 tried to allocate more heap memory and couldn’t, even after running garbage collection (GC) attempts. That can happen for several reasons:
- A true memory leak: objects that should become unreachable remain referenced.
- Legitimate high memory usage: you need lots of memory (large dataset, big JSON, image/video buffers, etc.).
- Memory fragmentation / poor object lifetime patterns: lots of short-lived allocations can stress GC and lead to stalls; sometimes crashes follow.
- External (non-heap) memory pressure:
Bufferallocations, native addons, or memory-mapped IO can consume memory outside the JS heap. - Container limits: your process might be constrained by cgroups (Docker/Kubernetes). Node might think it can use more, but the container kills it—or V8 limits differ.
A good workflow distinguishes these quickly.
Know your memory types: heap vs RSS vs external
When debugging, don’t focus only on “heap used”. Track a few key metrics:
- Heap Total / Heap Used: V8-managed JS objects.
- External: memory used by
Buffers and some native allocations tracked by V8. - RSS (Resident Set Size): total memory used by the process (includes heap, stack, native memory, code space, mmap, etc.).
You can log these in-process:
jssetInterval(() => {
  const m = process.memoryUsage();
  // Values in bytes
  console.log({
    rssMB: (m.rss / 1024 / 1024).toFixed(1),
    heapUsedMB: (m.heapUsed / 1024 / 1024).toFixed(1),
    heapTotalMB: (m.heapTotal / 1024 / 1024).toFixed(1),
    externalMB: (m.external / 1024 / 1024).toFixed(1),
    arrayBuffersMB: (m.arrayBuffers / 1024 / 1024).toFixed(1)
  });
}, 10_000).unref();
Interpretation tips:
- If heapUsed grows steadily and never drops meaningfully after GC, suspect a leak in JS objects.
- If external or RSS grows while heap stays stable, suspect
Bufferusage, native addons, or streaming/backpressure issues.
Step 1: Reproduce reliably (and make it measurable)
Before reaching for advanced tooling, make sure you can reproduce and measure.
Create a minimal repro harness
If the issue occurs in a server, you want a deterministic load generator.
- Use
autocannonfor HTTP services. - Use a fixed set of requests that triggers the suspected code path.
Example:
bashnpx autocannon -c 50 -d 120 http://localhost:3000/heavy-endpoint
While running, log memory usage periodically (as shown above) and capture timestamps.
Force a GC signal (only in debug)
Start Node with:
bashnode --expose-gc server.js
Then, at intervals:
jsif (global.gc) global.gc();
If after forcing GC the heap still climbs, you likely have retained references.
Warning: Don’t run with --expose-gc in production as a “fix”. It’s a diagnostic tool.
Step 2: Understand (and set) heap limits correctly
Increasing heap size with --max-old-space-size
The most common “band-aid”:
bashnode --max-old-space-size=4096 server.js
This sets V8’s old generation (long-lived objects) heap limit to ~4GB. It can be appropriate when:
- you legitimately need more heap (e.g., in-memory cache, big data transforms), and
- the application is otherwise stable.
But if you have a leak, raising the limit just delays the crash.
Containers and cgroup awareness
In Docker/Kubernetes, memory limits can be lower than the host. Modern Node versions are generally cgroup-aware, but mismatches can happen with older versions or specific setups.
Best practice:
- Ensure your Node version is current LTS.
- Align
--max-old-space-sizewith your container memory limit, leaving room for native memory and overhead.
Rule of thumb:
- If a container has 2GB memory limit, don’t set heap to 2GB. Leave headroom (e.g., 1200–1500MB) for RSS overhead.
Step 3: Collect evidence (heap snapshots, profiles, and GC logs)
Option A: Chrome DevTools with --inspect
Start your app:
bashnode --inspect=0.0.0.0:9229 server.js
Open chrome://inspect → “Open dedicated DevTools for Node”.
Useful panels:
- Memory → Take Heap Snapshot
- Memory → Allocation instrumentation on timeline
- Performance (less common for memory, but can help correlate CPU + GC)
Heap snapshots are great for leak detection because they can show:
- Retainers: why an object is still reachable
- Dominators: what is retaining the most memory
Workflow:
- Warm up the app.
- Take Snapshot A.
- Apply load for N minutes.
- Force GC (debug only) and take Snapshot B.
- Compare B vs A.
Option B: Heap snapshots in production-ish environments with heapdump
Install:
bashnpm i heapdump
Add a signal handler:
jsimport heapdump from 'heapdump';

process.on('SIGUSR2', () => {
  const filename = `/tmp/heap-${Date.now()}.heapsnapshot`;
  heapdump.writeSnapshot(filename, (err, name) => {
    if (err) console.error('heapdump error', err);
    else console.log('heap snapshot written to', name);
  });
});
Then:
bashkill -USR2 <pid>
Caution: Snapshots can be large and pause-the-world. Use carefully.
Option C: clinic toolchain (Doctor / Flame / Heap Profile)
clinic is a strong “batteries included” suite:
clinic doctorfor general health checksclinic flamefor CPU profilingclinic heapprofilerfor heap growth
Example:
bashnpx clinic heapprofiler -- node server.js
Then run load, stop the process, and open the generated report.
Tool comparison (practical):
| Tool | Best for | Pros | Cons |
|---|---|---|---|
| Chrome DevTools | Interactive leak digging | Familiar UI, good retainers view | Harder in prod, requires inspect access |
| heapdump | Capturing snapshots on demand | Works without inspector; signal-based | Can be disruptive; large files |
| clinic heapprofiler | Visualizing heap growth over time | Great reports, easy run | Adds overhead; run in staging |
--trace-gc | GC behavior and frequency | Low setup | No object-level attribution |
GC tracing: quick signal of churn
Run:
bashnode --trace-gc --trace-gc-verbose server.js
You’ll see GC events and heap sizes. If you observe frequent major GCs and steadily increasing “old space”, suspect retention.
Step 4: Common leak patterns (with fixes)
1) Unbounded caches (the classic)
Bad:
jsconst cache = new Map();

export function getUser(id) {
  if (cache.has(id)) return cache.get(id);
  const user = expensiveFetchUser(id);
  cache.set(id, user); // never evicted
  return user;
}
Fix: use an LRU cache with TTL and size limits.
jsimport LRUCache from 'lru-cache';

const cache = new LRUCache({
  max: 50_000,
  ttl: 5 * 60 * 1000, // 5 minutes
  allowStale: false
});

export async function getUser(id) {
  const hit = cache.get(id);
  if (hit) return hit;
  const user = await expensiveFetchUser(id);
  cache.set(id, user);
  return user;
}
Debugging tip: in heap snapshots, unbounded caches show up as huge Map/Object dominators with many entries.
2) EventEmitter listener leaks
Symptoms: warnings like MaxListenersExceededWarning, growing memory over time.
Bad:
jsimport { EventEmitter } from 'node:events';
const bus = new EventEmitter();

function handleRequest(req, res) {
  bus.on('data', () => {
    // captures req/res in closure
  });
  res.end('ok');
}
Fix: remove listeners or use once, and avoid capturing per-request objects.
jsfunction handleRequest(req, res) {
  const onData = (payload) => {
    // handle payload without storing req/res
  };
  bus.once('data', onData);
  res.end('ok');
}
Better: design the event flow so requests don’t register global listeners.
3) Retaining large objects in closures
Bad pattern: storing a function that closes over a huge structure.
jsconst handlers = [];

export function registerHandler(bigConfig) {
  handlers.push(() => {
    // bigConfig retained forever
    return bigConfig.rules.length;
  });
}
Fix: store only the minimal needed data, or store an ID and look up on demand.
jsconst handlers = [];

export function registerHandler(configId) {
  handlers.push(() => {
    const cfg = loadConfigById(configId);
    return cfg.rules.length;
  });
}
Heap snapshot clue: lots of Closure (registerHandler) retaining arrays/objects.
4) Accumulating logs / arrays during batch processing
Bad:
jsconst results = [];
for (const item of items) {
  results.push(processItem(item));
}
return results;
If items can be huge, you may be building an unbounded array.
Fix options:
- Stream results
- Process in chunks
- Write to disk/database as you go
Chunking example:
jsasync function processInBatches(items, batchSize = 1000) {
  for (let i = 0; i < items.length; i += batchSize) {
    const batch = items.slice(i, i + batchSize);
    await Promise.all(batch.map(processItem));
  }
}
5) “Leaking” promises by never awaiting / never clearing references
Bad:
jsconst inflight = new Set();

function fireAndForget(task) {
  const p = doWork(task);
  inflight.add(p);
  // never removed if resolved/rejected
}
Fix:
jsfunction fireAndForget(task) {
  const p = doWork(task);
  inflight.add(p);
  p.finally(() => inflight.delete(p));
}
Heap snapshot clue: many Promise objects retained by a Set.
Step 5: Non-heap memory issues (Buffers, streams, and backpressure)
Many Node “out of memory” incidents are actually RSS growth due to Buffer usage.
Buffer accumulation from poor streaming patterns
Bad: reading entire streams into memory.
jsimport fs from 'node:fs';

const data = fs.readFileSync('huge-file.bin'); // loads all into memory
Fix: stream and process incrementally.
jsimport fs from 'node:fs';
import { pipeline } from 'node:stream/promises';

await pipeline(
  fs.createReadStream('huge-file.bin'),
  async function* (source) {
    for await (const chunk of source) {
      // process chunk
      yield chunk;
    }
  },
  fs.createWriteStream('out.bin')
);
HTTP response buffering
If you proxy or transform responses, ensure you’re not buffering the whole body unintentionally.
Use streaming libraries or native streams, and verify backpressure:
- In Node streams, backpressure is handled when you
pipeproperly. - If you manually write to a destination ignoring
write()return value, you can buffer unbounded.
Bad:
jssource.on('data', (chunk) => {
  dest.write(chunk); // ignoring backpressure
});
Better:
jssource.pipe(dest);
Or manually:
jssource.on('data', (chunk) => {
  if (!dest.write(chunk)) {
    source.pause();
    dest.once('drain', () => source.resume());
  }
});
Diagnosing external memory
Track process.memoryUsage().external and arrayBuffers. If these climb while heap is stable:
- search for
Buffer.concat,toString()on large buffers, or base64 conversions - review places where you store buffers in arrays/maps
- ensure streams are consumed
Step 6: A systematic heap snapshot workflow (what to look for)
When you open a heap snapshot, the UI can be overwhelming. A systematic approach helps.
- Sort by retained size (not shallow size)
- Retained size indicates the total memory that would be freed if that object were collected.
- Look for dominators
- Dominators often reveal the “root” container: a cache
Map, a global array, a request registry, etc.
- Dominators often reveal the “root” container: a cache
- Follow the retainers chain
- This answers: why is this object still alive?
Common “roots”:
globalreferences- module-scoped singletons (
const cache = ...) - timers (
setInterval) retaining closures - event emitters retaining listener functions
Example: timer retaining request objects
Bad:
jsconst pending = new Map();

export function track(reqId, req) {
  pending.set(reqId, req);
  setInterval(() => {
    // closure captures reqId; also pending keeps req alive
    console.log('still pending', reqId);
  }, 1000);
}
Fix:
- clear intervals
- don’t store full request objects (store minimal metadata)
jsconst pending = new Map();
const timers = new Map();

export function track(reqId, meta) {
  pending.set(reqId, meta);
  const t = setInterval(() => console.log('pending', reqId), 1000);
  timers.set(reqId, t);
}

export function untrack(reqId) {
  pending.delete(reqId);
  const t = timers.get(reqId);
  if (t) clearInterval(t);
  timers.delete(reqId);
}
Heap snapshot clue: Timeout objects or closures retaining maps/requests.
Step 7: Allocation profiling (finding where objects are created)
Heap snapshots tell you what’s retained. Allocation profiling helps you find where allocations happen.
DevTools: Allocation instrumentation on timeline
Use when:
- memory spikes during a specific request
- you need to identify hot allocation sites
Workflow:
- Start allocation timeline.
- Trigger the problematic route.
- Stop recording and inspect “Top down” allocation call stacks.
--heap-prof for V8 heap profiling (advanced)
Node can generate heap profiles:
bashnode --heap-prof --heap-prof-dir=./profiles server.js
This produces .heapprofile files you can analyze (often with DevTools). This is more advanced but can be automated in staging.
Step 8: Debugging in production safely
Production memory debugging must be careful: snapshots can be big, pause execution, and increase risk.
Recommended layered approach:
- Metrics & dashboards
- Export RSS/heap/external and GC pauses if possible.
- Track per-endpoint latency and error rates; memory problems often correlate with latency spikes.
- Lightweight on-demand diagnostics
- Signal-triggered heap snapshot (only when needed)
- Rate-limit snapshot creation and store securely
- Reproduce in staging with production traffic replay
- Use recorded requests or synthetic tests approximating the workload.
Node report (diagnostic report)
Node can generate a report including stack traces and some memory info. Enable on fatal errors:
bashnode --report-on-fatalerror --report-dir=/tmp --report-filename=report.json server.js
This won’t replace heap snapshots, but it’s useful context.
Step 9: Performance considerations: GC thrash vs leaks
Not all memory pain is a leak. Sometimes the heap is full of short-lived objects causing GC thrash.
Signs:
- high CPU in GC
- frequent minor/major GCs
- latency spikes under load
Mitigations:
- reduce temporary allocations (e.g., avoid building large intermediate arrays)
- reuse buffers for hot paths (carefully)
- avoid excessive JSON parse/stringify cycles
- use streaming and incremental parsing for large payloads
Example: avoid Array.map(...).filter(...).reduce(...) chains on very large arrays in hot loops; consider a single pass.
Step 10: Best practices to prevent memory regressions
1) Put hard bounds everywhere
- caches: max entries, TTL
- queues: max length, drop/timeout strategy
- request body sizes: enforce limits
Example with Express (body limit):
jsimport express from 'express';

const app = express();
app.use(express.json({ limit: '1mb' }));
2) Be explicit about lifecycle
If you create:
- listeners → remove them
- intervals/timeouts → clear them
- per-request state stored globally → delete it
3) Add memory tests to CI for critical services
You can create a basic “soak test”:
- run a service for 10–30 minutes under load
- assert memory stabilizes (within a tolerance)
A simple approach is to sample heapUsed over time and fail if it grows monotonically beyond a threshold.
4) Track dependency risks
Some leaks come from libraries (e.g., unbounded memoization, global registries). Pin versions, monitor changelogs, and when you suspect a dependency:
- reproduce with a minimal script
- bisect versions
- inspect open issues
5) Prefer streaming APIs for large data
- file uploads/downloads
- ETL and batch jobs
- large JSON: consider NDJSON (newline-delimited JSON) or streaming parsers
A realistic case study: “heap out of memory” in an API server
Scenario:
- Node API runs fine initially.
- Under sustained traffic, memory climbs until crash.
- HeapUsed grows steadily; RSS follows.
Investigation
- Add periodic logging of
process.memoryUsage(). - Run
autocannonagainst the heaviest endpoint. - Start with
--inspectin staging. - Take heap snapshot before load and after 10 minutes.
Findings
In snapshot B:
- A
MapnameduserCachedominates retained size. - Retainers show it’s module-scoped and never evicted.
Fix
Replace Map with LRU + TTL (as shown earlier). Add metrics on cache size.
Verification
- Repeat load test.
- Observe heap rises initially then stabilizes.
- Ensure tail latencies improved due to fewer major GCs.
This pattern—unbounded growth due to “helpful caching”—is extremely common.
Quick triage checklist
When you see the error again, walk this list:
- Is it heap or RSS/external?
- Compare
heapUsedvsrssvsexternal.
- Compare
- Does forced GC reduce heap? (debug only)
- If no: likely retained references.
- Is there an unbounded structure?
Map,Set, arrays, queues, caches.
- Are there listener/timer leaks?
- Growing listeners, un-cleared intervals.
- Are you buffering large payloads?
- Request bodies, responses, file reads.
- Can you reproduce under load?
- Use
autocannonand capture snapshots.
- Use
- Is
--max-old-space-sizea legitimate fix?- Only if memory use is expected and bounded.
Closing guidance
Fixing “JavaScript heap out of memory” is less about memorizing flags and more about adopting a repeatable debugging loop:
- Measure (heap/RSS/external)
- Reproduce under controlled load
- Capture evidence (snapshots/profiles)
- Identify retainers (the “why”)
- Fix with bounds and lifecycles
- Verify with soak tests
If you share the exact workload pattern (API, batch job, streaming pipeline) and a few memory metrics over time (heapUsed/external/RSS), you can usually narrow the root cause quickly and choose the right tool—DevTools snapshots for retained-object leaks, allocation timelines for spikes, and stream/backpressure analysis for external memory growth.