Distributed systems fail in ways that single-process applications rarely do. Requests traverse multiple services, networks introduce latency and packet loss, clocks drift, dependencies partially fail, and retries can amplify load into cascading outages. Debugging in this environment is less about stepping through code in a debugger and more about reconstructing reality from signals: logs, metrics, traces, events, and the state of many components.
This article is a practical guide to debugging distributed systems for software developers and engineers. It covers common failure modes, an investigation workflow, concrete instrumentation patterns (with code), debugging techniques you can use during incidents, tool comparisons, and best practices that reduce mean time to detect (MTTD) and mean time to resolve (MTTR).
1) What makes distributed debugging hard?
Before techniques, it helps to name the problem.
1.1 Non-determinism and partial failure
In a monolith, a bug is often reproducible in a local environment. In distributed systems:
- Partial failure is normal: one instance is down, one AZ is degraded, one dependency is rate-limiting.
- Timing matters: a bug only manifests under specific latency, concurrency, or load conditions.
- Backpressure and retries change the system’s behavior during failure, making reproduction tricky.
1.2 Emergent behavior
A harmless change in service A can overload service B due to increased fan-out, causing timeouts that feed back into A. Debugging becomes about understanding a graph of services and their interactions.
1.3 Observability gaps
If you can’t answer:
- “Which request is failing and where?”
- “Is this localized to a region/version/tenant?”
- “What changed?”
…then you’re not debugging; you’re guessing.
Observability is the foundation: instrumentation that allows you to ask new questions without redeploying.
2) A systematic workflow for incidents
When an incident hits, you need a repeatable process.
2.1 Triage: define symptoms and blast radius
Start with what’s measurable:
- User impact: error rate, latency percentiles (p95/p99), timeouts, SLO burn.
- Scope: specific endpoints? specific tenants? regions? versions?
- Change correlation: deploys, config changes, scaling events, dependency outages.
Practical checklist:
- Compare current vs baseline metrics.
- Segment metrics by labels:
region,cluster,service_version,endpoint,tenant. - Identify whether failures are server-side (5xx), client-side (4xx), or network/timeouts.
2.2 Form hypotheses and test quickly
Good hypotheses are specific:
- “New version of
payment-serviceincreased calls tofraud-service, causingfraud-servicesaturation and timeouts.”
Test by:
- Looking for increased RPS to dependency.
- Checking dependency saturation signals: CPU, memory, thread pools, queue depth.
- Inspecting traces for time spent in dependency spans.
2.3 Reduce variables
- Roll back can be a diagnostic tool.
- Disable non-critical features.
- Shift traffic gradually (canary) to isolate.
2.4 Confirm root cause and apply mitigations
Mitigation first when impact is high:
- rate limit, shed load, increase timeouts carefully, add circuit breakers, scale.
Then fix:
- patch bug, improve instrumentation, add tests, update runbooks.
2.5 Post-incident: “close the loop”
Capture:
- A timeline (deploys, alerts, metrics inflection points)
- What signals were missing
- Concrete action items (instrumentation, alarms, limits, runbooks)
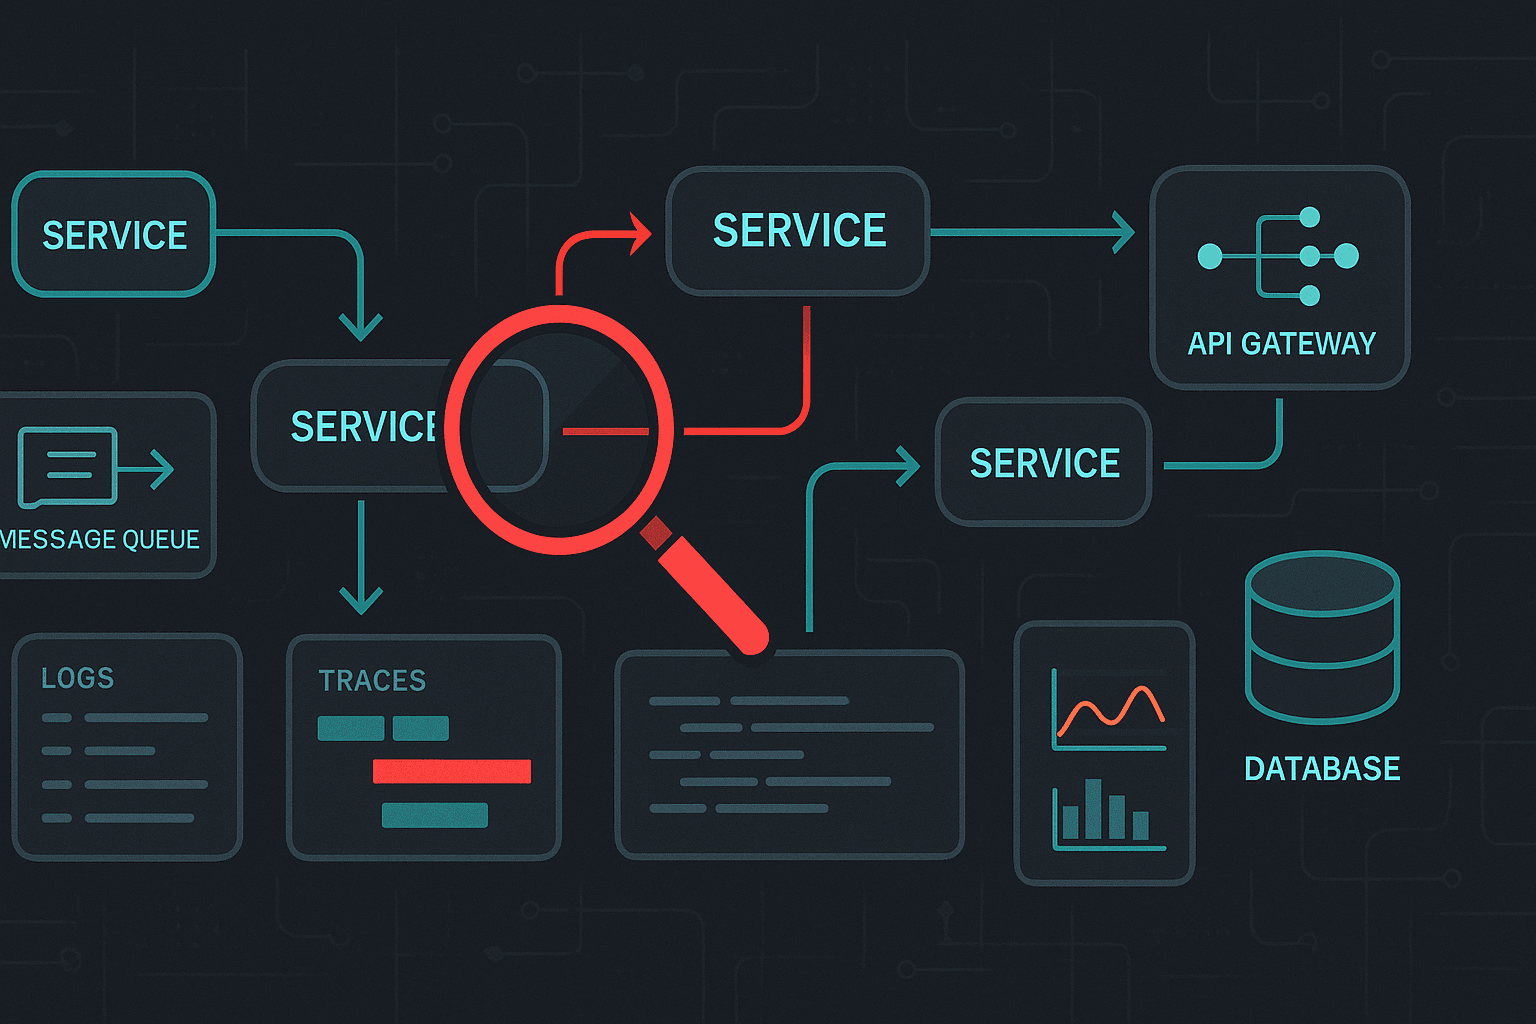
3) The three pillars: logs, metrics, and traces
You rarely solve distributed incidents with only one signal.
3.1 Metrics: detect and quantify
Metrics answer: “Is it bad? How bad? When did it start? Who is affected?”
Key types:
- RED (Requests, Errors, Duration) for request-driven services
- USE (Utilization, Saturation, Errors) for resources
Minimum service metrics:
http_requests_total{status,route}http_request_duration_seconds_bucket{route}(histograms for p95/p99)dependency_request_duration_seconds_bucket{dependency}in_flight_requests/ queue depths- JVM/Go runtime metrics if applicable
3.2 Logs: explain what happened
Logs answer: “What happened for this specific request or component?”
Best practices:
- Structured logs (JSON) with consistent fields
- Include correlation IDs:
trace_id,span_id,request_id - Avoid sensitive data; apply redaction
Example structured log (JSON):
json{
  "ts": "2026-02-18T10:12:33.123Z",
  "level": "error",
  "service": "checkout-service",
  "env": "prod",
  "trace_id": "7c2b8d8f2d6e5f1a",
  "span_id": "9a3d...",
  "route": "/checkout",
  "user_id_hash": "u_8b1...",
  "error": "timeout calling payment-service",
  "timeout_ms": 800,
  "attempt": 2
}
3.3 Traces: locate where time is spent
Tracing answers: “Where did this request go, and what was slow/failing?”
With good traces you can:
- Find the slowest spans in a path
- Identify fan-out explosions (N+1 calls)
- Spot retries (multiple spans to same dependency)
- Attribute latency to a specific service or dependency
4) Instrumentation patterns (with code)
4.1 Propagate context everywhere
The single most important distributed debugging practice is context propagation (trace IDs, request IDs, and baggage/attributes).
Node.js (Express) with OpenTelemetry
jsimport express from "express";
import { NodeSDK } from "@opentelemetry/sdk-node";
import { getNodeAutoInstrumentations } from "@opentelemetry/auto-instrumentations-node";
import { OTLPTraceExporter } from "@opentelemetry/exporter-trace-otlp-http";

const sdk = new NodeSDK({
  traceExporter: new OTLPTraceExporter({ url: process.env.OTEL_EXPORTER_OTLP_ENDPOINT }),
  instrumentations: [getNodeAutoInstrumentations()],
});
await sdk.start();

const app = express();

app.get("/checkout", async (req, res) => {
  // The auto-instrumentation will create a span and propagate context.
  // Add domain attributes for better debugging.
  req.log?.info?.({ route: "/checkout" }, "handling checkout");
  res.json({ ok: true });
});

app.listen(3000);
Tips:
- Ensure your HTTP client library is instrumented too (axios/fetch).
- Add meaningful span attributes like
tenant_id(hashed),order_size, orfeature_flag.
Go (net/http) context propagation
gofunc handler(w http.ResponseWriter, r *http.Request) {
    ctx := r.Context() // carries trace/span context

    req, _ := http.NewRequestWithContext(ctx, "GET", "http://payment/charge", nil)
    // Use an instrumented http.Client to propagate headers.
    resp, err := httpClient.Do(req)
    if err != nil {
        log.With("trace_id", traceIDFromContext(ctx)).Error("payment call failed", "err", err)
        http.Error(w, "upstream error", 502)
        return
    }
    _ = resp.Body.Close()
    w.WriteHeader(200)
}
4.2 Add “golden signals” for every dependency
For each outbound dependency call:
- count requests
- count errors
- record duration histogram
- track retries/timeouts separately
This enables quick isolation: “is it us or the dependency?”
4.3 Log sampling vs trace sampling
In high volume systems you must sample.
- Trace sampling: head-based (at ingress) or tail-based (after seeing latency/error)
- Log sampling: keep all errors, sample info logs
Common strategy:
- Keep 100% of error traces
- Sample a small percentage of successful traces
- Keep structured error logs at 100%
Tail-based sampling (e.g., in OpenTelemetry Collector) is particularly valuable because you can retain slow/error traces without overwhelming storage.
5) Common failure modes and how to debug them
5.1 Timeouts: the most common distributed “bug”
Symptoms:
- rising p99 latency
- spikes in 504/502
- thread pool or worker exhaustion
Debugging steps:
- Use traces to locate the slowest span(s).
- Check if latency is uniform (dependency slow) or bimodal (retries/timeouts).
- Check saturation metrics: CPU, GC, connection pools.
Best practices:
- Set timeouts explicitly at every hop.
- Avoid “infinite” timeouts; they cause resource leaks.
- Make upstream timeouts greater than downstream timeouts to avoid wasted work.
Rule of thumb:
- If service A calls service B, A’s timeout should be slightly higher than B’s internal work, but not so high that it ties up resources.
5.2 Retries and retry storms
Retries can turn a minor blip into an outage.
Debug signals:
- Increased outbound RPS despite stable inbound RPS
- Multiple similar spans in traces (attempt 1, attempt 2…)
- Elevated queue depth / connection pool exhaustion
Mitigations:
- Exponential backoff + jitter
- Retry budgets (limit retry rate)
- Circuit breakers
5.3 Connection pool exhaustion
Symptoms:
- errors like “no available connections”
- latency rises with concurrency
- CPU may look normal, but waiting time increases
Debugging:
- Track pool metrics (in-use, idle, wait time)
- Use profiling to see goroutines/threads blocked on I/O
- Check DNS or load balancer behavior (too many distinct endpoints)
5.4 Thundering herds and cache stampedes
Symptoms:
- sudden DB load spike after cache expiry
- latency spikes aligned with TTL boundaries
Debugging:
- Identify cache hit ratio changes
- Trace fan-out to DB
Mitigations:
- request coalescing (single-flight)
- probabilistic early expiration
- serve stale while revalidate
5.5 Message queue poison pills and reprocessing loops
Symptoms:
- a consumer repeatedly fails on the same message
- backlog grows
Debugging:
- add message IDs to logs/traces
- inspect dead-letter queues (DLQ)
- record failure reason and payload schema version
Mitigations:
- DLQ with alerts
- idempotent consumers
- schema evolution strategy
5.6 Data consistency and “it looks correct in one service”
Symptoms:
- users see stale state
- services disagree about entity status
Debugging:
- log and trace with entity identifiers
- verify event ordering and clock skew
- check read replicas lag
Mitigation patterns:
- outbox pattern
- versioned events
- idempotency keys
6) Debugging techniques that work in practice
6.1 Trace-first debugging (when you have good tracing)
Approach:
- Find a failed request trace.
- Identify the first span that errors.
- Ask: is this error propagated properly or masked?
- Compare failing and successful traces.
Good trace attributes to include:
http.route,http.method,http.status_codenet.peer.name,net.peer.portdb.system,db.statement(careful with sensitive data)- domain attributes:
tenant,order_id_hash,feature_flag
6.2 Correlate by deploy version and config
Always label telemetry with:
service.version(git SHA)deployment.environment- config version (or hash)
Then you can answer:
- “Did error rate start exactly when version X rolled out?”
6.3 Use exemplars: link metrics to traces
Some monitoring stacks support exemplars (a trace ID attached to a histogram bucket sample). This is powerful:
- See a p99 spike → click exemplar → open an actual trace that contributed.
If your stack supports it (Prometheus + OpenTelemetry can), enable it.
6.4 Query logs like data
Treat logs as a dataset:
- group by error type
- count over time
- filter by route/version/tenant
Example mental model:
- “Top 5 exception types in the last 15 minutes”
- “Error rate by
service.version” - “Timeouts by dependency”
6.5 Reproduce with traffic capture (carefully)
When a bug is input-dependent:
- capture request metadata (headers, sizes, not secrets)
- replay in a staging environment
Tools/patterns:
- API gateway request mirroring (shadow traffic)
- feature flags to enable verbose instrumentation for a subset of traffic
6.6 Production-safe debugging: feature-flagged verbosity
Instead of redeploying with extra logs:
- include debug logging but guard behind a runtime flag
- enable for a specific request ID or tenant
Example idea:
- if header
X-Debug: trueand request is authenticated/internal, log extra context and keep trace sampling at 100%.
7) Tooling landscape and comparisons
Your choice depends on scale, budget, and operational maturity. The key is interoperability and avoiding vendor lock-in where possible.
7.1 OpenTelemetry (OTel): the standard instrumentation layer
Strengths:
- vendor-neutral APIs/SDKs
- supports traces, metrics, logs (logs maturing)
- ecosystem: auto-instrumentation, collectors, exporters
Tradeoffs:
- configuration complexity
- requires careful sampling/export tuning
Recommendation: adopt OTel for instrumentation even if you use a commercial backend.
7.2 Tracing backends
Common options:
- Jaeger: open-source, widely used; great for traces; operational overhead.
- Zipkin: simpler, older ecosystem.
- Grafana Tempo: integrates well with Grafana; cost-effective at scale; relies on logs/metrics for indexing.
- Commercial: Datadog, New Relic, Honeycomb, Lightstep (now part of ServiceNow), etc.
Comparison axes:
- indexing and query capability
- tail-based sampling support
- cost model (ingest-based can get expensive)
- correlation UX (metrics ↔ traces ↔ logs)
7.3 Metrics: Prometheus vs others
- Prometheus: de facto standard; powerful PromQL; great for Kubernetes; needs remote storage for long retention.
- Grafana Mimir / Cortex / Thanos: scalable Prometheus-compatible storage.
- Commercial options provide managed scaling and alerting.
7.4 Logs: Elasticsearch/OpenSearch vs Loki
- ELK/OpenSearch: full-text search; expensive at scale; strong for complex log queries.
- Grafana Loki: cheaper by indexing labels only; pairs well with traces (Tempo) and metrics.
Rule of thumb:
- If you need heavy full-text search, ELK/OpenSearch is strong.
- If you want cost-effective, label-based logs with correlation to traces, Loki is compelling.
8) Debugging in Kubernetes and cloud environments
8.1 Start with the control plane view
In Kubernetes, many “application bugs” are actually platform issues:
- OOMKills
- CrashLoopBackOff
- node pressure / eviction
- failing readiness/liveness probes
- misconfigured HPA
Useful commands:
bashkubectl get pods -n prod
kubectl describe pod <pod> -n prod
kubectl logs <pod> -n prod --previous
kubectl top pods -n prod
kubectl get events -n prod --sort-by=.lastTimestamp
8.2 Debug ephemeral network issues
Network issues are common and subtle:
- DNS resolution delays
- misconfigured timeouts at load balancers
- MTU issues
Techniques:
- run a debug pod in the same namespace/node pool
curlwith timing breakdowndigto test DNS
Example:
bashkubectl run -it --rm netdebug --image=nicolaka/netshoot -n prod -- bash
curl -w "\nnamelookup: %{time_namelookup}\nconnect: %{time_connect}\nstarttransfer: %{time_starttransfer}\ntotal: %{time_total}\n" -o /dev/null -s https://service-b.prod.svc.cluster.local/health
8.3 Use profiling for CPU/memory issues
- Go:
pprof - JVM: JFR, async-profiler
- Node:
--inspect,clinic, heap snapshots
In distributed debugging, profiling helps when one service is the bottleneck due to CPU, lock contention, or GC.
9) Best practices that prevent debugging pain
9.1 Design for failure
Implement:
- timeouts
- retries with jitter and budgets
- circuit breakers
- bulkheads (isolate resources)
- load shedding
9.2 Make requests idempotent
Especially for:
- payments
- order creation
- state transitions
Use idempotency keys:
- client sends
Idempotency-Key - server stores result keyed by that ID for a period
9.3 Error handling: preserve causality
A common debugging killer is turning every error into “500 internal error” without context.
Best practices:
- wrap errors with context (
dependency,operation,timeout_ms) - return safe, structured error responses
- include error codes (not just strings)
9.4 Version everything
- APIs (backward compatible changes)
- events (schema version)
- configs (hash or version)
Then log the version in every request.
9.5 Runbooks and ownership
When incidents occur at 3am:
- a clear on-call rotation
- dashboards per service
- runbooks with “if X then check Y”
Runbook minimum:
- service purpose
- dependencies
- SLOs and dashboards
- common failure modes and mitigations
- rollback procedure
10) A concrete example: debugging a latency regression
Scenario:
- After deploying
catalog-servicev1.8.0, p99 latency on/searchincreases from 400ms to 2.5s. - Error rate remains low, but users complain.
Step 1: segment by version
Metrics show:
- p99 latency high only for
service.version=1.8.0
Conclusion: likely regression tied to deploy.
Step 2: inspect traces for slow requests
Traces show:
catalog-servicespan is long.- Inside it, there are many repeated calls to
inventory-service.
A before/after comparison shows:
- v1.7.9 made 1 call to
inventory-service. - v1.8.0 makes ~50 calls (one per item).
Classic N+1.
Step 3: confirm with logs
Structured logs include items_returned and inventory_calls:
- v1.8.0 logs show
inventory_calls=items_returned.
Step 4: mitigate
Short-term:
- rollback to v1.7.9
Long-term fix:
- change to batch inventory lookup
- add a guardrail metric:
inventory_calls_per_search - add a trace attribute and alert when above threshold
Step 5: prevent recurrence
- Add a load test that asserts max dependency calls per request.
- Add a code review checklist item: “No per-item network calls in hot paths.”
11) Practical dashboards and alerts
11.1 Service dashboard essentials
For each service:
- RPS by route
- Error rate by route/status
- Latency p50/p95/p99 by route
- Saturation: CPU, memory, GC, thread pools, queue depths
- Dependency latency/error panels
11.2 Alerting philosophy
Avoid alert storms. Alert on user impact and symptom-based triggers:
- SLO burn rate alerts
- high error rate (5xx) sustained
- high latency (p99) sustained
- saturation approaching limits
Then use dashboards/logs/traces for root cause.
12) Summary
Debugging distributed systems is an observability and systems-thinking discipline. The best engineers combine:
- Instrumentation (structured logs, metrics, tracing with context propagation)
- A repeatable workflow (triage → hypothesize → test → mitigate → fix → learn)
- Failure-aware design (timeouts, retries with budgets, circuit breakers, idempotency)
- Tooling that correlates signals (metrics ↔ traces ↔ logs)
If you invest in the fundamentals—consistent context propagation, dependency golden signals, and meaningful service-level dashboards—you’ll spend far less time guessing and far more time making targeted, confident fixes.