Why debugging feels harder in modern stacks
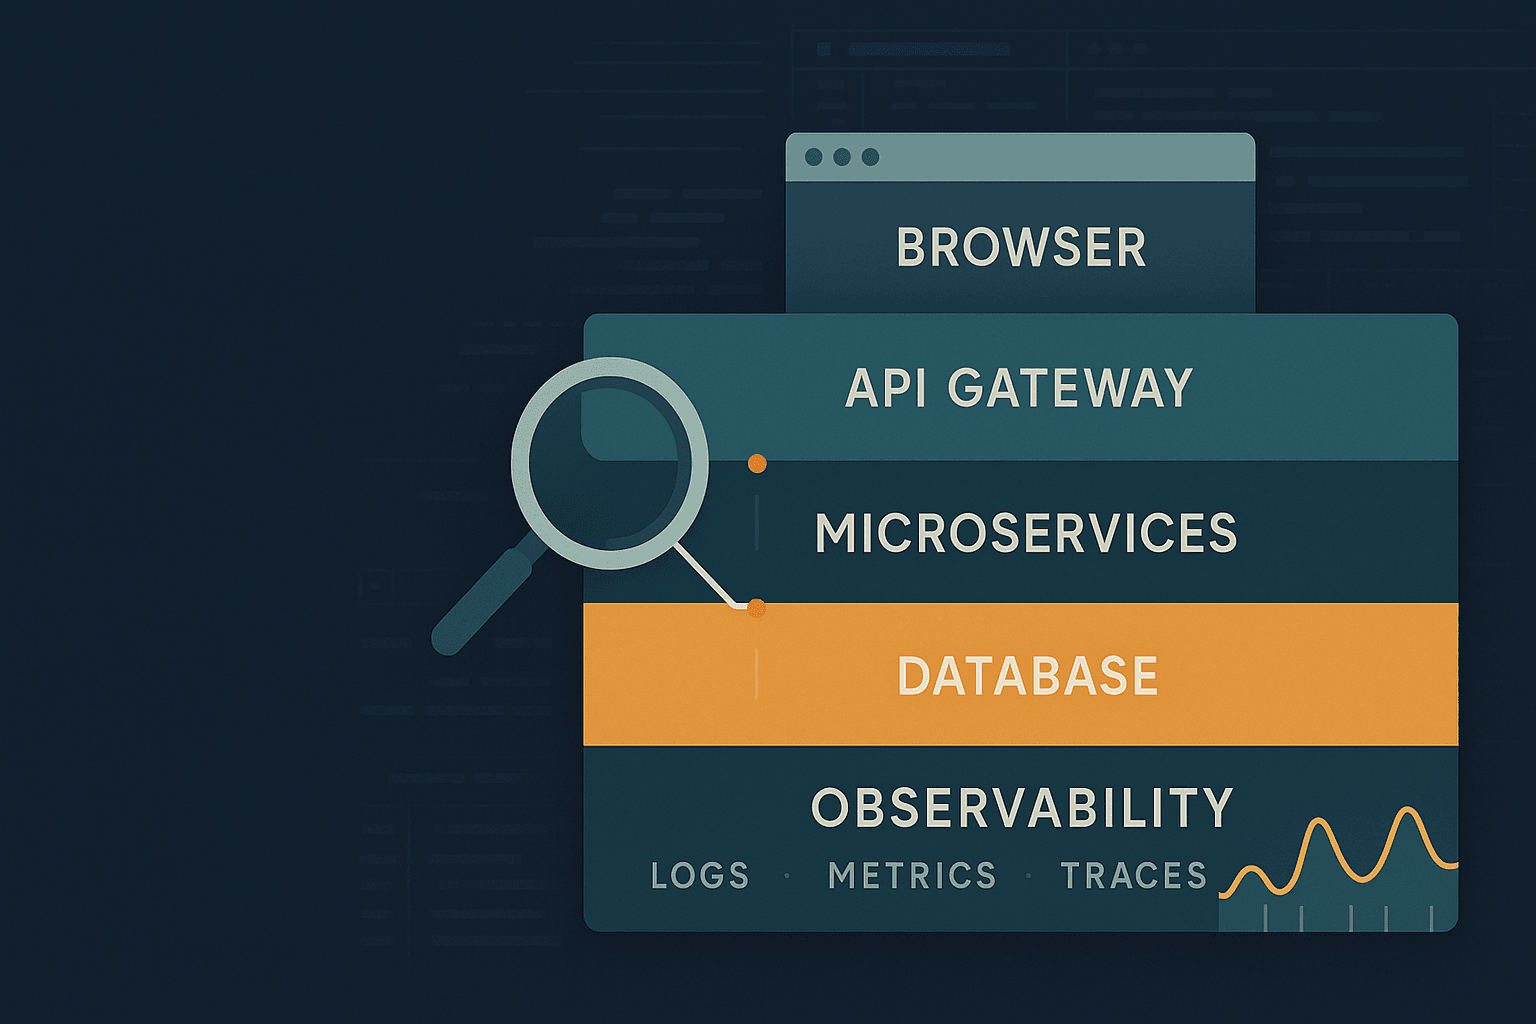
Debugging used to mean stepping through a single process with predictable inputs. Modern web applications are distributed across layers and boundaries:
- Frontend: SPA frameworks (React/Vue/Angular), bundlers (Vite/Webpack), SSR/SSG (Next.js/Nuxt), hydration, browser APIs.
- Backend: microservices, async queues, serverless functions, polyglot languages.
- Data layer: caches, databases, search indices, CDC, eventual consistency.
- Infrastructure: containers, orchestration, edge/CDNs, proxies, TLS, WAFs.
A bug might be “in the UI,” but triggered by:
- a race condition in state management
- a stale CDN cached response
- a misconfigured CORS header
- a time skew affecting JWT validation
- a subtle API contract mismatch
This guide provides a structured approach, concrete techniques, and tool comparisons to help you debug systematically—from browser to backend to production.
A debugging mindset: reduce uncertainty, then isolate
The best debuggers don’t start by changing code—they start by constraining the problem.
1) Make the bug reproducible
A bug you can’t reproduce is usually one of:
- nondeterministic (race condition, timing, concurrency)
- environment-specific (only in prod, only on iOS Safari)
- data-dependent (specific user account, feature flag state)
Practical steps:
- Capture the exact steps, user account, request payload, and timestamps.
- Collect a HAR file (network capture) from the browser.
- Snapshot relevant feature flags, local storage, cookies.
- Record versions: commit SHA, build ID, release tag.
2) Create a minimal failing case
Reduce the surface area until only the failing behavior remains:
- Temporarily disable optional features.
- Hardcode data and remove API calls to prove whether it’s frontend logic vs backend.
- If backend: isolate the endpoint in a standalone test harness.
3) Form hypotheses and falsify them
Write hypotheses like:
- “The UI shows stale data because the cache key excludes userId.”
- “The 500 happens only when the payload includes an empty
itemsarray.”
Then design a quick experiment to prove/disprove.
4) Prefer observation over guesswork
Add logging, tracing, or temporary metrics. Don’t “fix” what you haven’t measured.
Debugging in the browser: beyond console.log
The browser is where many bugs manifest first. Chrome DevTools (and Firefox DevTools) are extremely powerful when used methodically.
Network debugging: the fastest path to truth
Open DevTools → Network and answer:
- Was the request sent?
- What are the headers and payload?
- What status code came back?
- Is it cached? (memory cache/disk cache/service worker)
- Is it blocked by CORS or mixed content?
- Is it slow due to DNS/TLS/TTFB/download?
Common patterns
1) CORS issues
Symptoms:
- Request appears as blocked.
- Console shows:
Access-Control-Allow-Originmissing.
Fixes:
- Backend must return correct CORS headers.
- Don’t forget preflight (
OPTIONS) requirements when using custom headers.
2) Service worker cache gotchas
If you use a service worker (PWA), it can serve stale responses even after deployments.
Debug steps:
- DevTools → Application → Service Workers
- Check “Update on reload”
- Unregister service worker to confirm behavior
3) CDN caching pitfalls
Compare response headers across environments:
Cache-Control,Age,ETag,Vary- CDN-specific headers (e.g.,
cf-cache-status,x-cache)
Source maps and stepping through bundled code
If you can’t debug with breakpoints because code is minified, ensure source maps are working.
Checklist:
devtool: 'source-map'(Webpack) or proper Vite config- Upload source maps to error monitoring (Sentry, etc.)
- Ensure you’re viewing the original sources in DevTools
Breakpoints that matter
Instead of sprinkling logs, use targeted breakpoints:
- Line-of-code breakpoints in relevant modules
- XHR/fetch breakpoints to stop when a network call happens
- Event listener breakpoints (click, submit, keydown)
- DOM mutation breakpoints when an element changes unexpectedly
Debugging React/Vue state
For React:
- React DevTools → inspect component props/state
- Verify memoization assumptions (
useMemo,React.memo) - Watch for stale closures in hooks
Example: stale closure bug
jsfunction SearchBox() {
  const [query, setQuery] = useState('');

  useEffect(() => {
    const id = setInterval(() => {
      // BUG: query is captured at effect creation time
      console.log('query:', query);
    }, 1000);
    return () => clearInterval(id);
  }, []);

  return <input value={query} onChange={e => setQuery(e.target.value)} />;
}
Fix by including dependencies or using refs:
jsuseEffect(() => {
  const id = setInterval(() => {
    console.log('query:', query);
  }, 1000);
  return () => clearInterval(id);
}, [query]);
Or:
jsconst queryRef = useRef(query);
useEffect(() => { queryRef.current = query; }, [query]);
useEffect(() => {
  const id = setInterval(() => console.log(queryRef.current), 1000);
  return () => clearInterval(id);
}, []);
Performance debugging (often “buggy UI” is just slow)
Use:
- DevTools → Performance
- Lighthouse (for a baseline)
- React Profiler
Look for:
- long tasks blocking main thread
- excessive renders
- expensive JSON parsing or layout thrashing
Backend debugging: logs, debuggers, and controlled experiments
Structured logging > println debugging
Logs should be:
- structured (JSON)
- correlated (request IDs)
- leveled (debug/info/warn/error)
- safe (avoid secrets)
Example (Node.js with pino):
jsimport pino from 'pino';
import { randomUUID } from 'crypto';

const logger = pino({ level: process.env.LOG_LEVEL || 'info' });

export function withRequestLogger(req, res, next) {
  req.id = req.headers['x-request-id'] || randomUUID();
  req.log = logger.child({ requestId: req.id });
  res.setHeader('x-request-id', req.id);
  next();
}
Then log with context:
jsreq.log.info({ userId, path: req.path }, 'handling request');
Reproducing with a curl script
Turn browser behavior into a deterministic repro:
bashcurl -i 'https://api.example.com/v1/orders' \
  -H 'authorization: Bearer <token>' \
  -H 'content-type: application/json' \
  --data '{"items":[],"coupon":"SAVE10"}'
If you can reproduce with curl, you can automate it in tests.
Debuggers: when to step through
- Use a debugger when the behavior depends on complex control flow.
- Use logs/traces when the behavior depends on timing or distributed calls.
Node.js inspector (VS Code)
Start with:
bashnode --inspect-brk server.js
Attach VS Code debugger. Great for stepping through request handlers.
Java/Spring
Remote debugging in containers often requires:
- JVM debug flags
- port exposure
Example:
bashJAVA_TOOL_OPTIONS="-agentlib:jdwp=transport=dt_socket,server=y,suspend=n,address=*:5005"
Then attach IDE debugger to port 5005.
Debugging concurrency and async issues
Symptoms:
- intermittent failures
- missing updates
- deadlocks/timeouts
Tactics:
- Add timestamps and request IDs everywhere.
- Log state transitions, not just errors.
- Use timeouts with explicit error messages.
Example: ensuring an async operation doesn’t hang forever
jsfunction withTimeout(promise, ms, label = 'operation') {
  let id;
  const timeout = new Promise((_, reject) => {
    id = setTimeout(() => reject(new Error(`${label} timed out after ${ms}ms`)), ms);
  });
  return Promise.race([promise, timeout]).finally(() => clearTimeout(id));
}
API contract debugging: schemas, validation, and drift detection
Many bugs are contract mismatches:
- frontend sends
camelCase, backend expectssnake_case - field becomes optional/required without coordination
- enums differ by one value
Use schema validation at boundaries
If you validate input early, you get immediate, actionable errors.
Example (TypeScript + zod):
tsimport { z } from 'zod';

const CreateOrder = z.object({
  items: z.array(z.object({
    sku: z.string(),
    qty: z.number().int().positive(),
  })).min(1),
  coupon: z.string().optional(),
});

export function parseCreateOrder(body: unknown) {
  return CreateOrder.parse(body);
}
Now invalid input becomes a 400 with a useful message (if you map it).
Consumer-driven contract tests
Tools:
- Pact (popular for microservices)
- OpenAPI schema checks
Benefits:
- catch drift before deployment
- generate fixtures
Production debugging: observability is your safety net
Local debugging is necessary, but real bugs often occur only:
- under real load
- with real data
- in complex deployments
The three pillars: logs, metrics, traces
Logs
Good for:
- error details
- unexpected branches
Bad for:
- understanding multi-service latency
Metrics
Good for:
- seeing rates, percentiles, saturation
Examples:
- request rate (RPS)
- error rate
- latency percentiles (p50/p95/p99)
- queue depth
Distributed tracing
Best for:
- following a single request through many services
- identifying which hop is slow or failing
Use OpenTelemetry to standardize instrumentation.
Correlation IDs everywhere
If you do one thing to improve debugging: propagate a correlation ID.
- inbound request: read
x-request-idor generate - downstream calls: include it
- logs: include it
- traces: set it as an attribute
Error monitoring with source maps
Tools:
- Sentry
- Rollbar
- Honeybadger
Make sure to:
- upload source maps for frontend
- include release versions
- attach breadcrumbs (network calls, UI events)
Debugging in production without breaking things
Avoid “SSH into the box and hack.” Prefer:
- feature flags for safe toggles
- canary releases
- runtime config changes
- sampling logs/traces
For truly hard issues:
- record/replay tools (where available)
- eBPF-based profiling/observability (advanced)
A systematic workflow: from symptom to root cause
Here’s a repeatable sequence that works across many incident types.
Step 1: Triage and scope
- Who is affected? (one user vs all)
- When did it start? (after deploy, after config change)
- Which environments? (prod only, specific region)
Step 2: Classify the failure
- Client-side error (JS exception)
- Network issue (timeouts, DNS, TLS)
- Server error (5xx)
- Data correctness bug (wrong output but 200)
Step 3: Inspect the request path
- Browser network timeline
- API gateway logs
- service logs
- DB query logs (careful with PII)
Step 4: Identify the first divergence
The “first divergence” is where expected and actual behavior first differ.
Examples:
- request payload is already wrong before leaving the browser
- response is correct but UI renders wrong
- backend computed wrong value after a specific query
Step 5: Reduce to a minimal repro and codify it
Turn the repro into:
- a unit test
- an integration test
- a regression test in CI
This prevents the same bug from reappearing.
Practical bug case studies (with techniques)
Case study 1: Intermittent 401s due to clock skew
Symptoms:
- Users randomly get logged out.
- Backend says token expired, but user just logged in.
Debugging steps:
- Inspect JWT
iatandexpvalues and compare to server time. - Look for servers in a cluster with incorrect NTP sync.
- Check if tokens are validated with strict time checks.
Fixes:
- Ensure NTP is configured.
- Allow small leeway in JWT validation (e.g., 30–60 seconds) depending on security requirements.
Case study 2: “UI shows old data after save” (cache invalidation)
Symptoms:
- User updates profile, UI still shows old name.
Debugging steps:
- Confirm API response from save endpoint includes the new value.
- Verify GET profile endpoint returns new value.
- Check client caching library (React Query/Apollo) and invalidation keys.
Example (React Query):
tsconst queryClient = useQueryClient();

const mutation = useMutation(updateProfile, {
  onSuccess: () => {
    queryClient.invalidateQueries({ queryKey: ['profile'] });
  }
});
Common pitfall: query key includes userId but invalidation doesn’t.
Case study 3: Memory leak in Node from event listeners
Symptoms:
- memory grows over time
- warnings:
MaxListenersExceededWarning
Debugging steps:
- Capture heap snapshots (Chrome DevTools for Node, or
heapdump). - Look for retained objects and listener arrays.
- Audit code that adds listeners but never removes them.
Fix pattern:
- remove listeners in cleanup
- use
once()when appropriate
Tool comparisons: choosing the right debugging and observability stack
Browser tools
- Chrome DevTools: best all-around; strongest performance tooling.
- Firefox DevTools: excellent CSS debugging, some different perspectives.
API debugging
- curl: deterministic, scriptable.
- HTTPie: more human-friendly.
- Postman/Insomnia: good for collections, auth flows, team sharing.
Logging
- ELK/EFK (Elasticsearch + Logstash/Fluentd + Kibana): powerful search; operational overhead.
- Loki + Grafana: simpler index model; cost-effective.
- Cloud-native (CloudWatch, GCP Logging): convenient; can get expensive.
Tracing
- OpenTelemetry: instrumentation standard; vendor-neutral.
- Backends: Jaeger, Zipkin, Tempo, commercial APMs.
APM suites
- Datadog, New Relic, Dynatrace: integrated experience; cost and lock-in considerations.
Best practice: use OpenTelemetry for instrumentation so you can change backends.
Debugging techniques that scale with complexity
1) Binary search the code path
When you don’t know where a bug is, bisect:
- add logs at midpoints
- toggle features / code blocks
- narrow the region until you isolate the fault
This can be faster than “read the whole system.”
2) Use feature flags to isolate and mitigate
Feature flags help you:
- disable suspect code paths
- ship instrumentation safely
- canary fixes
3) Record enough context to reproduce
For backend errors, log:
- request ID
- endpoint and method
- authenticated user ID (if allowed)
- sanitized payload summary
- downstream dependency status
Be careful about:
- tokens
- passwords
- PII
4) Treat flaky tests as debugging practice
Flaky tests are a controlled environment for nondeterminism.
Approach:
- run the test in a loop
- capture logs per run
- reduce concurrency
- add time control (fake timers)
Preventing bugs: design for debuggability
The easiest bug to debug is the one you prevent—or the one that fails loudly.
Defensive programming at boundaries
- Validate inputs
- Normalize data formats
- Fail fast with clear errors
Add invariants and assertions
In critical code paths:
- assert non-null assumptions
- assert sorting assumptions
- validate state machines
Make errors actionable
Prefer:
Error: Payment declined: insufficient_funds (provider=Stripe, requestId=...)
Over:
Error: Payment failed
Keep releases observable
Every release should have:
- a version identifier in logs and in the UI footer
- source maps uploaded
- dashboards ready (latency, error rate)
A pragmatic debugging checklist
Use this when you’re stuck:
- Can I reproduce it reliably? If not, what’s variable?
- Is it client, network, server, or data?
- What changed recently? (deploy, config, feature flag)
- What do the network requests show?
- Do logs include correlation IDs and useful context?
- Is there a trace showing where time/error occurs?
- Can I reduce to a minimal repro and add a regression test?
Closing thoughts
Debugging is a skill built on systems thinking and disciplined investigation. Tools like DevTools, structured logging, OpenTelemetry tracing, and robust error monitoring don’t replace reasoning—they amplify it. If you invest in reproducibility, correlation, and debuggability-by-design, you’ll spend less time chasing ghosts and more time shipping reliable software.